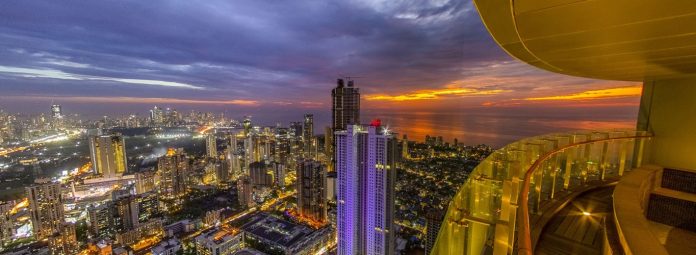
MMR real estate witnesses 38% surge in property registration value to ₹54,240 cr in first quarter of 2024, says squareyards.com
MUMBAI, Apr 26 (The CONNECT) – Mumbai Metropolitan Region (MMR) has reaffirmed its position as India’s premier residential market recording 60,719 transactions, amounting to a substantial Rs 54,239 crores, during the first quarter of 2024.
| Summary | |||
| MMR | Q4’2023 | Q1’2024 | Change in % |
| Number of Transactions | 46638 | 60719 | 30% |
| Sale Value (in Cr) | 39170.1 | 54239.2 | 38% |
Data Source: IGR Maharashtra, squareyards.com
The first quarter saw Lodha Group (Macrotech Developers) maintain its prominent position as the top performer in terms of volume and units sold on the back of heightened demand with 1881 units amounting to Rs 2318 crores, said squareyards.com, an Integrated real estate marketplace.
Oberoi Realty held on to the second spot in terms of total sale value registering Rs 1717 crores while Runwal Group maintained the second spot in number of units sold with 679 transactions.
| Top Developer in MMR by No.of Transaction – (Jan-Mar’24) | |||
| Developer | Sale Value in Cr | No. of Transaction | |
| 1 | Lodha Group | 2318.2 | 1881 |
| 2 | Oberoi Realty | 1717.1 | 264 |
| 3 | Hiranandani Group | 1061.7 | 438 |
| 4 | Rustomjee Builders | 750.2 | 264 |
| 5 | Runwal Group | 748.2 | 679 |
| 6 | Godrej Properties | 717.3 | 402 |
| 7 | Kalpataru | 685.0 | 306 |
| 8 | K Raheja Corp | 676.0 | 72 |
| 9 | The Wadhwa Group | 641.7 | 203 |
| 10 | L&T Realty | 590.5 | 294 |
Data Source: IGR Maharashtra, squareyards.com
Planned infrastructure development, particularly the upcoming metro lines enhancing connectivity to major hubs, is spotlighting new micro-markets for investment opportunities in MMR, said Ganesh Devadiga, SVP and Sales Director, Square Yards.
Dosti Greater Thane secured first position as the top-selling project in the Mumbai Metropolitan Region (MMR) based on sales transactions followed by Runwal Gardens and Dosti West County.
| Top Projects in MMR by No.of Transaction -(Jan-Mar’24) | |||
| Project Name | No. of Transaction | Sale Value in Cr. | |
| 1 | Dosti Greater Thane | 360 | 162.3 |
| 2 | Runwal Gardens | 228 | 128.6 |
| 3 | Dosti West County | 218 | 159.5 |
| 4 | Lodha Amara | 196 | 207.2 |
| 5 | Lodha Upper Thane | 166 | 70.8 |
| 6 | Regency Anantam | 165 | 65.5 |
| 7 | L And T Centrona | 153 | 172.4 |
| 8 | Lodha Crown Dombivli | 136 | 49.1 |
| 9 | Galaxy Heights | 134 | 57.6 |
| 10 | Maya Narayani Dham | 133 | 26.7 |
Data Source: IGR Maharashtra, squareyards.com
In Q1 2024, Thane West emerged as the leading locality for real estate transactions, with an impressive 5000+ units sold. This area emerged as a prime choice for new homebuyers and investors due to its offering of a diverse range of properties from affordable to luxurious.
Improved infrastructure and transportation facilities have made commuting easier, contributing to the overall appeal of the Thane. Additionally, the rapid development of social infrastructure, including schools, hospitals, shopping centers, and recreational facilities, has further elevated the desirability of these localities, making them an attractive choice for residents and investors seeking convenience, connectivity, and lifestyle amenities.
| Top Locations in MMR by No.of Transaction -(Jan-Mar’24) | |||
| Location | No. of Transaction | Sale Value in Cr. | |
| 1 | Thane West | 5,004 | 4,948.7 |
| 2 | Dombivli East | 2,985 | 1,286.0 |
| 3 | Mira Road East | 2,848 | 1,752.7 |
| 4 | Virar West | 1,427 | 497.8 |
| 5 | Ulwe | 1,269 | 574.7 |
| 6 | Kandivali West | 1,200 | 1,070.8 |
| 7 | Badlapur East | 1,183 | 294.9 |
| 8 | Vasai East | 1,138 | 348.8 |
| 9 | Kalyan West | 1,103 | 503.2 |
| 10 | Andheri West | 1008 | 1,987.2 |
Data Source: IGR Maharashtra, squareyards.com
Analyzing the budget and area-wise demand from January to March 2024, properties priced below 50 Lacs constituted the majority of transactions at 51%. Properties priced between 50 Lacs to 1 Cr. accounted for 24% of transactions. In terms of area, properties ranging from 0-500 Sqft. were most in demand, making up 56% of the transactions.
| Budget wise Demand – MMR (Jan-Mar’24) | Area Wise Demand – MMR (Jan-Mar’24) | |||
| Budget | No. of Transaction | Area in Sqft | No. Of transaction | |
| <50 Lacs | 51.7% | 0-500 | 56.0% | |
| 50 Lacs – 1Cr | 24.2% | 500-1000 | 37.7% | |
| 1Cr – 2Cr | 16.0% | 1000-1500 | 4.5% | |
| 2Cr – 3Cr | 4.3% | 1500-3000 | 1.3% | |
| 3Cr + | 3.8% | 3000+ | 0.4% | |
Data Source: IGR Maharashtra, squareyards.com
Given the high yields in the MMR region, top developers in the area are diligently addressing market needs, focusing on factors such as affordability, amenities, and space requirements. A comprehensive approach to area development, coupled with ongoing infrastructure improvements, is poised to contribute positively to this prestigious real estate market in 2024.


